According to the journal Chemical Engineering, an important property of a fiber is its water absorbency. A random sample of 20 pieces of cotton fiber is taken and the absorbency on each piece was measured. The following are the absorbency values:
| 18.71 | 21.41 | 20.72 | 21.81 | 19.29 | 22.43 | 20.17 |
| 23.71 | 19.44 | 20.50 | 18.92 | 20.33 | 23.00 | 22.85 |
| 19.25 | 21.77 | 22.11 | 19.77 | 18.04 | 21.12 |
a. Calculate the sample mean and median for the above sample values.
b. Compute the 10% trimmed mean.
c. Do a dot plot of the absorbency data.
SOLUTION:
Part a
We are given


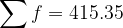
The mean is


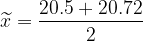
If we arrange the data from least to greatest, the 10th and 11th data are 20.5 and 20.72. The median therefore is

Part b
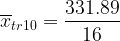
If we removed the 10% from the bottom and 10% from the top of the data arranged from least to greatest, the 4 values will be eliminated. The values eliminated are 18.04, 18.71, 23, and 23.71. Therefore, the sum of the remaining data is


The trimmed mean is

Part c
A dotplot is shown below
